Aug 122011
 
MDX Cookbook

Hi all,

if you’ve been wondering where have I been hiding all these months, the answer is here – I was writing a book for Packt Publishing Ltd. The book, named MDX with Microsoft SQL Server 2008 R2 Analysis Service: Cookbook, is finally out and available on publisher’s site. Soon, it should be available on Amazon and in other popular book stores.

For those of you who prefer the e-book over the paperback edition, it’s good to know that the PDF version already exists on publisher’s site, while the ePub and Mobi are coming soon. Same is with the Kindle Edition on Amazon.

UPDATE (27th of August): On Amazon US, the paperback edition is available here, the Kindle edition here.

Looking forward to receiving your feedback :-)

May 152010
 

Boyan Penev recently blogged about a strange behavior which manifests when ordering two related sets thereby mentioning a thread in SSAS forum answered by Deepak Puri. I found this intriguing and decided to reply directly, but the explanation kept growing, so I finally cut everything out and put it as an article on my blog instead. After all, this way my chances of being enlisted in his blog roll should increase 8-).

Here’s the problem in short. The first query works, the second doesn’t. The difference? The second query has related hierarchies while the first one doesn’t.

WITH
SET [RowSet]    AS [Product].[Subcategory].Levels(1).Members
SET [ColumnSet] AS [Date].[Calendar].Levels(1).Members
SELECT
     Order( [RowSet], [ColumnSet].Item(0), BDESC ) ON ROWS,
     [ColumnSet]                                   ON COLUMNS
FROM [Adventure Works]


WITH
SET [RowSet]    AS [Product].[Subcategory].Levels(1).Members
SET [ColumnSet] AS [Product].[Category].Levels(1).Members
SELECT
     Order( [RowSet], [ColumnSet].Item(0), BDESC ) ON ROWS,
     [ColumnSet]                                   ON COLUMNS
FROM [Adventure Works]


Now, some of you may have already guessed this has to be a case of attribute relations and yes, I admit you’re right. Nevertheless, I think an analysis would be beneficial, after all Boyan asked for it.

First, let’s make a small but important distinction. Those queries look like they have been written by a T-SQL developer. Why am I saying it? Because in T-SQL, ORDER is typically (although not necessarily) based on a column, be it numeric, date or string. A set being returned is ordered based on the values of that column.

In MDX, ORDER() is based on an expression which means that the second argument is automatically converted to a tuple (ColumnSet.Item(0)), and then a value of it: (ColumnSet.Item(0)).Value. Let’s see how those two MDX queries might look like in T-SQL.

use AdventureWorksDW2008;

with
t as
(
select
    SubCategory = s.EnglishProductSubcategoryName,
    CalendarYear = d.CalendarYear,
    ResellerSales = sum(f.SalesAmount)
from dbo.DimProductSubcategory s
    join dbo.DimProduct p
        on p.ProductSubcategoryKey = s.ProductSubcategoryKey
    join dbo.FactResellerSales f
        on f.ProductKey = p.ProductKey
    join dbo.DimDate d
        on d.DateKey = f.OrderDateKey
group by
    s.EnglishProductSubcategoryName,
    d.CalendarYear
)
, pvt as
(
select * from t
pivot( sum(ResellerSales)
       for CalendarYear in ( [2001], [2002], [2003], [2004], [2006] ) ) as pvt
)
select * from pvt
order by
— sort A
[2001] desc;
— sort B
/*
(select sum(ResellerSales) from t
        where t.SubCategory = pvt.SubCategory and
              t.CalendarYear = 2001) desc;
*/


with
t as
(
select
    SubCategory = s.EnglishProductSubcategoryName,
    Category = c.EnglishProductCategoryName,
    ResellerSales = sum(f.SalesAmount)
from dbo.DimProductSubcategory s
    join dbo.DimProduct p
        on p.ProductSubcategoryKey = s.ProductSubcategoryKey
    join dbo.FactResellerSales f
        on f.ProductKey = p.ProductKey
    join dbo.DimProductCategory c
        on c.ProductCategoryKey = s.ProductCategoryKey
group by
    s.EnglishProductSubcategoryName,
    c.EnglishProductCategoryName
)
, pvt as
(
select * from t
pivot( sum(ResellerSales)
       for Category in ( [Bikes], [Components], [Clothes], [Accessories] ) ) AS pvt
)
select * from pvt
order by (select sum(ResellerSales) from t
          where –t.SubCategory = pvt.SubCategory and
                t.Category = ‘Accessories’
         ) desc;


They return exactly the same result as those two MDX queries. Btw, who says MDX is not elegant and easy?

Now, let’s analyze them.

The first query is ordered by column [2001]. We said that MDX uses expressions when sorting, so we’ll try to do the same using an expression. We can comment [2001] DESC and un-comment what’s below “sort B”, but the result won’t change.

In the second query I deliberately skipped sorting by a column (ORDER BY [Accessories] DESC) and used the version with an expression in order to get the false result. The column version would yield the correct, expected result. While we might have thought sorting in MDX behaves that way, the truth is it doesn’t. MDX has some specifics and we need to use the expression version in order to show them.

Important thing to notice is that in both queries there’s a join which binds subcategories (disregard it being commented in the second query at the moment, act like it’s still there). We can imagine this as being the first phase in setting the condition of those correlated sub-queries.

The next phase would be to expand this by specifying the argument of the Order() statement in MDX. In case of a Date dimension, that was year 2001. Since that is a different dimension, nothing has changed in our initial condition.

In the second query, there was a related hierarchy (same dimension) which came after the initial phase, so it forced everything so far to adjust to it (which btw might be seen as a third phase). You can imagine this third phase as limiting the join further by adding conditions like this:

and exists (select ProductCategoryKey from dbo.DimProductCategory
            where EnglishProductCategoryName = pvt.SubCategory)


When the related hierarchy is “below” the current one, the initial join could be considered as removed (instead of bringing this extra EXISTS which makes no sense if you analyze what’s inside). Therefore I commented it in the query. In fact, I manually did what SSAS engine implicitly does to joins from the initial phase when a related hierarchy comes in the second phase and when the relation is 1:N, or in OLAP terms – below granularity.

When it is “above”, the initial join is just more limited (now it makes sense to use EXISTS).

In DAX it would be something like the ALL() function (for analogies between MDX, T-SQL and DAX I suggest reading my previous blog article).

Err, one more thing, the join is based on keys rather than names, but for simplicity reasons I haven’t included them in queries.

Now let’s get back to OLAP and it’s multidimensional space.

Cube’s space is N-dimensional which means each coordinate should be N-di
mensional too. SSAS formula engine fills the missing parts using the current members of non-mentioned hierarchies. But who are they?

Based on members explicitly specified in a coordinate, the engine implicitly (the way a trigger fires in T-SQL) finds members on related hierarchies. They become current members of those hierarchies. For non-mentioned dimensions (not hierarchies), the engine picks current members which again are “current” because of some previous context set by an expression, function, slicer or the cube itself.

In the first example year 2001 sets the context of that expression. All the hierarchies of Date dimension implicitly shift their current members accordingly (which is not important in this case, but let it be known). Since the Product and others dimension were not mentioned in that expression, we traverse to previous contexts (backwards) in order to find their current members. The Filter() function sets the immediate previous context. For Product dimension, Product.Subcategory hierarchy to be precise. – How come? – Well, Filter() is sort of a loop, which means we iterate over members in its set (the first argument) which in turn become “current” in that expression, one by one. Other dimensions are not important in this case but the process of identifying current members might be visualized likewise.

In the second example Accessories category sets the context. Its presence automatically shifts Product.Subcategory current member to a related position. – Where? – To its root member. – Why? – Because relation is 1:N. If it were N:1, it would shift to a single related member. Since it can’t find one, it shifts to its root member which is a way of saying “I can not find a direct relation to a single member, therefore I’ll move to a place where I don’t stand in a way, a neutral position that doesn’t change the (explicit) coordinate, though complies to the obligation of me being present in the coordinate”.  – Let me think it through a bit … OK, I see. But how come the current member of Product.Subcategory hierarchy didn’t stay too? I mean, he was in Filter() function too, as the first argument. – Correct, but they are not treated the same. – Why’s that? – Layers! – What? – Calculation layers. In form of a stack. On top there’s only Accessories because only that was explicitly there in the expression and that expression is the last thing evaluated in the Filter() function. – Why is that the last thing? – Well, first you need to set a loop. Then you evaluate the expression for each member, right? As you would do in programming, loop is outside, assignments and calculations are inside the loop. Therefore, Product.Subcategory set (and its current members in a loop) is one layer below in this stack. Whoever is NOT on top, or shall we say BELOW the layer being currently evaluated might be implicitly shifted. Might, because it depends whether he’s related or not. If he is, as in the second example, he will shift, but if he isn’t as in the first example, nothing will happen. He’ll come unchanged. In turn, he might determine who’ll be shifted among his “relatives” in layers below his. And so on. The winner takes it all approach among “relatives” and the winner is the “relative” being explicitly in the coordinate, on top of the others. – Oh, I see. Current and lower layers you say … Wait, I got an idea! In order to make them equal, we should bring them on the same layer, right? – Exactly! – And how do you suggest we should do that? – The expression. That determines the top layer in this case so both of them should be there. – Ok, but how? – Simple, by providing a tuple. We should expand the existing condition with .CurrentMember of the first set.

Here are both the false and the correct MDX for the second query, to emphasize their differences.

WITH
SET [RowSet]    AS [Product].[Subcategory].Levels(1).Members
SET [ColumnSet] AS [Product].[Category].Levels(1).Members
SELECT
     Order( [RowSet], [ColumnSet].Item(0), BDESC ) ON ROWS,
     [ColumnSet]                                   ON COLUMNS
FROM [Adventure Works]
 

WITH
SET [RowSet]    AS [Product].[Subcategory].Levels(1).Members
SET [ColumnSet] AS [Product].[Category].Levels(1).Members
SELECT
     Order( [RowSet], ( [ColumnSet].Item(0),
                      
[RowSet].CurrentMember ), BDESC ) ON ROWS,
     [ColumnSet]                                          ON COLUMNS
FROM [Adventure Works]


Forcing the current member is like saying “I want my current member to stay and not get implicitly converted to other members. I’m forcing this coordinate and I know what I’m doing, return me the value of this explicitly requested intersection (aka coordinate)!”.

Now, return to the second T-SQL query and un-comment the join. You’ll get the correct result because this time you explicitly forced the join. Or shall we say you prevented this join from disappearing in T-SQL just as you prevented the current member in MDX from changing because of attributes relations in that dimension. Interesting?

Finally, it wouldn’t hurt to specify the same tuple in the first MDX query too. I mean, the result would not change, they would stay correct. So, if you, the reader of this article, are searching for the expression which works in any scenario, use the one with the tuple.

Important thing to remember. In MDX you can almost always omit current members in your expressions. Yet, when dealing with related hierarchies, as in this example, specifying them or not makes a world of difference.

The question remains – why there is this attribute relations mechanism in OLAP? Well, that might be a topic for some other article. For now let’s just say that it keeps the multidimensional space smaller and consistent. And although it behaves like a wormhole, it’s here to help. Without it, we might get lost out there.

Jan 232010


Average among siblings, as a calculated measure, is typically used to compare the result of each member in a group where the group is formed from his siblings. In case of a known hierarchy, the core expression is relatively easy.

(
[<Dimension name>].[<Hierarchy name>].CurrentMember.Parent,
 
[Measures].[<Measure name>]
)
/
Count(
      NonEmpty(
               [<Dimension name>].[<Hierarchy name>].CurrentMember.Siblings,
               [Measures].[<Measure name>]
              )
     )

<> represent placeholders.

The expression says – take the parent’s value and divide it by the count of siblings that have results (only those, not all of them). Of course, we should add testing for zero as well as testing for empty values. Also, we could use sum of siblings instead of parent’s value because at least one member has no parent (root member). Or we should test whether current member has a parent and if not, then only use the sum of siblings version of expression. Might be faster on large dimensions. For simplicity, we won’t cover it here, not to complicate too much.

iif(
    IsEmpty( [Measures].[<Measure name>] ),
    null,
    iif(
        Count(
              NonEmpty(
                       [<Dimension name>].[<Hierarchy name>].CurrentMember.Siblings,
                       [Measures].[<Measure name>]
                      )
             ) = 0,
        null,

       Sum(
           [<Dimension name>].[<Hierarchy name>].CurrentMember.Siblings,
           [Measures].[<Measure name>]
          )
        /
       Count(
             NonEmpty(
                      [<Dimension name>].[<Hierarchy name>].CurrentMember.Siblings,
                      [Measures].[<Measure name>]
                     )
            )
        )
    )

But if the requirement is to make that expression work for any hierarchy (no matter whether that dimension only or for any hierarchy in a cube), we have to reach for the Axis() function.

In case of Excel 2007 as a front-end, the following code should be put into MDX script. Only one thing will be dependant on your cube and that is the first calculated measure. There you should provide a measure for calculation of average among siblings. In this code, Sales Amount from Adventure Works 2008 was used, but as I said, any measure will do. The rest of the code is cube independent, meaning, it will work in any cube and for any hierarchy.

Create Member CurrentCube.[Measures].[Original Measure] AS
    [Measures].[Sales Amount]
;

Create Member CurrentCube.[Measures].[Where are measures in Excel] AS
    case
        when NOT IsError(Extract( Axis(0), Measures ).Count) then 0
        when NOT IsError(Extract( Axis(1), Measures ).Count) then 1
        else -1
    end
;

Create Member CurrentCube.[Measures].[Where are non-measure rows] AS
    iif(
         NOT IsError(Axis(1).Count) AND
             [Measures].[Where are measures in Excel] < 1,
         1,
         iif(
              [Measures].[Where are measures in Excel] <> 0 AND
              NOT IsError(Axis(0).Count),
              0,
              null
            )
       )
;

Create Member CurrentCube.[Measures].[Average Measure] AS
    iif( IsEmpty([Measures].[Original Measure]),
         null,
         iif( IsEmpty([Measures].[Where are non-measure rows]),
              [Measures].[Original Measure],
              iif( Axis([Measures].[Where are non-measure rows]).Item(0).Item(0)
                       .Hierarchy.CurrentMember.Level.Ordinal = 0,
                   [Measures].[Original Measure],       
                   Sum(Axis([Measures].[Where are non-measure rows]).Item(0).Item(0)
                           .Hierarchy.CurrentMember.Siblings,
                       [Measures].[Original Measure])
                   /
                   Count(NonEmpty(Axis([Measures].[Where are non-measure rows]).Item(0).Item(0)
                                      .Hierarchy.CurrentMember.Siblings,
                                  [Measures].[Original Measure]))                               
                 )
            )
       )
, FORMAT_STRING = ‘Currency’
;

As you can see, we define a calculated measure Original measure to be used throughout the other part of the code. Next, we test where Excel 2007 has put the measures. They could be on rows, columns or slicer (WHERE part). Excel uses only 2 axes and a slicer, doesn’t use axis(2) aka pages like OWC.

We test by counting measures extracted from an axis and testing whether that produces an error. If so, measures are not there. If they are not on rows or columns, then they must be in slicer. When we have only one measure, Excel puts that measure in slicer. When there are more measures, they are either on rows or columns, depending on other hierarchies in query.

Once we know where the measures are, we test where is a hierarchy that we need an average for. Although it seems sometimes that hierarchy is on one particular axis (let say rows), Excel tricks us with display and generates MDX with that hierarchy on columns for example. Not always, but sometimes. That’s why we need to test where that hierarchy is. Btw, we’re interested in the first hierarchy that appears on rows, that is the mode of work. And we return the average among siblings result for its members.

The next calculation follows. If there is something on rows in query and measures are on columns or slicer, then we have the position of our hierarchy (it is positioned on rows). If the measures are not on columns but something else is (that’s the scenario where Excel swaps axes), then take position 0 as the place where our hierarchy is. As said, hierarchy is actually on columns although visually it looks like it’s on rows. In all other scenarios take null as result.

Finally, we come to the main expression. As explained in the simple example above, we must test whether the original measure was empty. If so, we must provide the same for our calculated measure not to include that row in result when NON EMPTY was used on axes. Then we test where that hierarchy of choice is. In case of null, which means there is no hierarchy in the query other than measures, we provide the original value since the average of a single member is the same member’s result. In the main part of this expression we test for root member and provide the same value (orig
inal value) since that’s an average for him. In all other cases the expression comes down to sum of siblings over count of siblings with result (hence NonEmpty() part). Without handling empty members, our average would be false.

In the end, we take care of format string and test if it works.

That’s it.

Here’s an example of it in action.

image

The article was inspired by this thread.

Oct 252009


Creating a Bit array (also known as Bitmap) is an useful technique when analyzing data. Especially (but not necessarily) in case of low cardinality (small number of distinct values in column compared to the number of records in a table). For example, a column having two distinct values (male/female or yes/no status) could be optimized in storage and represented using values 0 and 1 only (bits).

A collection of such bits forms a bit array or a bitmap. Bitmap indexes use those arrays performing bitwise operations on them.

Almost all DSS and analytical systems use bitmap indexes, and so does Analysis Services. An example where it can be seen is SQL Server Profiler. Query Subcube event represents the bitmap of hierarchies and attributes being used in a query. Yet, what’s fine for computers might not be for humans, hence there’s also Query Subcube Verbose event which explains that in plain English. Kind of.

Although SSAS engine intensively uses them, bitwise operations in MDX are in short supplies. In spite of that, the same idea can be borrowed and turned in action using string functions. After all, an alternate name for bit array is bitstring.

Recently I’ve participated in a case where a measure was expected to return the percentage of parent no matter which hierarchy is placed on an axis and no matter how many of them are there. Actually, a similar problem appeared on MSDN SSAS forum a year ago too. While the initial problem in this latter case was solved using special solution, general solutions emerged also. The offer ranged from heavy string manipulation to recursion and stored procedure. Taking a look at it now, from the perspective of this case, I believe bitmap indexes might have been an alternate MDX solution, a relatively fast approach that doesn’t require anything but a query and few calculated members aside.

Here’s a case study featuring the bitmap index as the key point in obtaining the general solution.

SITUATION

The idea was to have a general solution for percentage (ratio to parent). One calculated measure covering all scenarios, meaning, whatever combination of hierarchies appears in OWC (cube browser).

The problem that soon appeared was this – no matter how much improved the calculation in each iteration I posted in forum was (a previous thread and my blog article on that subject), there was always a case where it didn’t fit. Therefore I started focusing on getting as detailed explanation as possible. When I finally got it (as an Excel sheet) and analyze it, deduced the algorithm and describe it like this (as in integrams):

  •  
    • if there was a non-root member in the rightmost hierarchy, show ratio to parent
    • root member in the rightmost hierarchy combined with all non-root members from other hierarchies to the left should result in 100%
    • if all hierarchies were on root member, the result should be 100%
    • in all other situations, ratio to parent for non-root member should be the result

The idea in integrams (I couldn’t link for them in English, it’s an enigmatic game) is to mark certain events that hold true and other that can never be such. By doing so in iterations (reading the initial text over and over again, every time in new context), one should be able to deduce the final combination of entities in a puzzle and thereby solve it. The idea here was to list all possible combinations using a bitmap, where 0 represents non-root member, 1 root member and their sequence, well, …the sequence of hierarchies on axis. Translated, that would look like this (asterisk being any value):

CASE BITMAP VALUE REQUIRED RESULT
**0 0, 2, 4, 6, … (even numbers) parent of 3rd
001 1 parent of 3rd (self), special case for 100%, per request
011 3 parent of 1st
101 5 parent of 2nd
111 7 parent of 1st, special case for 100%


Now, see how this looks more like a solvable case? And so it was. The only thing necessary at this stage is to code it using MDX expressions in the most optimized way.

SOLUTION

A general MDX for this could be far more simpler than the one below. However, the requirement was that it should work in OWC and OWC has its specifics when it comes to MDX, about which I blogged here. Therefore, I had to make a lot of additional things, like testing where OWC put measures and everything related to that in later calculations. Nevertheless, I managed to make it work as required.

Create Member CurrentCube.[Measures].[Where are measures in OWC] AS
case
when NOT IsError(Extract( Axis(0), Measures ).Count) then 0
        when NOT IsError(Extract( Axis(1), Measures ).Count) then 1
        when NOT IsError(Extract( Axis(2), Measures ).Count) then 2
        else -1  -- should not be possible
end
    , Visible = 0
;

Create Member CurrentCube.[Measures].[Ratio measure] AS
-- specify a measure you want to have a ratio for, or
-- use default measure, or
-- use dynamic expression, that selects    -- either first measure on an axis or
-- the default measure in case no measure is selected

    /* -- option 1 */
    [Measures].[Sales Amount]
    /* -- option 2
    [Measures].DefaultMember
    */
    /* -- option 3
      iif(Extract( Axis( [Measures].[Where are measures in OWC] ),
                   Measures ).Item(0).Item(0).UniqueName =
          '[Measures].[Universal ratio %]',
          [Measures].DefaultMember,
          Extract( Axis([Measures].[Where are measures in OWC]),                   Measures ).Item(0)
         )
    */
    , Visible = 0
;

Create Member CurrentCube.[Measures].[Test Empty] AS
    IsEmpty( [Measures].[Ratio measure] )
    , Visible = 0
;

Create Member CurrentCube.[Measures].[Count of columns] AS
    iif( IsError( Axis(1).Count ),
         0,
         iif( [Measures].[Where are measures in OWC] = 1,
              Axis(0).Item(0).Count,
              Axis(1).Item(0).Count )
       )
    , Visible = 0
;

Create Member CurrentCube.[Measures].[Bitmap Index as String] AS
    iif( [Measures].[Where are measures in OWC] = 1,
        Generate( Head(Measures.AllMembers,                       [Measures].[Count of columns] ) AS L,
                  -(Axis(0).Item(0).Item(L.CurrentOrdinal - 1)                    .Hierarchy.CurrentMember.Level.Ordinal = 0)
              ),
        Generate( Head(Measures.AllMembers,                       [Measures].[Count of columns] ) AS L,
                  -(Axis(1).Item(0).Item(L.CurrentOrdinal - 1)                    .Hierarchy.CurrentMember.Level.Ordinal = 0)
          )
     )
    , Visible = 0
;

Create Member CurrentCube.[Measures].[Reversed Bitmap Index as String] AS
    iif( [Measures].[Where are measures in OWC] = 1,
        Generate( Head(Measures.AllMembers,                       [Measures].[Count of columns] ) AS L,
                  -(Axis(0).Item(0).Item([Measures].[Count of columns] -
                     L.CurrentOrdinal)                    .Hierarchy.CurrentMember.Level.Ordinal = 0)
              ),
        Generate( Head(Measures.AllMembers,                       [Measures].[Count of columns] ) AS L,
                  -(Axis(1).Item(0).Item([Measures].[Count of columns] -
                     L.CurrentOrdinal)                    .Hierarchy.CurrentMember.Level.Ordinal = 0)
              )
       )
    , Visible = 0
;

Create Member CurrentCube.[Measures].[Rightmost non root position] AS
    InStr([Measures].[Reversed Bitmap Index as String], '0')
    , Visible = 0
;

Create Member CurrentCube.[Measures].[Inner 100%] AS
    CInt([Measures].[Bitmap Index as String]) = 1
    , Visible = 0
;

Create Member CurrentCube.[Measures].[Universal ratio %] AS
    iif( [Measures].[Test Empty],
         null,
         iif( [Measures].[Rightmost non root position] = 0 OR
              [Measures].[Inner 100%],
              1,
              iif( [Measures].[Where are measures in OWC] = 1,
                   -- check division by zero
                   iif( ( Axis(0).Item(0)                          .Item([Measures].[Count of columns] -
                           [Measures].[Rightmost non root position])                          .Hierarchy.CurrentMember.Parent,
                          [Measures].[Ratio measure] ) = 0,
                        0,
                        [Measures].[Ratio measure]
                        /
                        ( Axis(0).Item(0)                          .Item([Measures].[Count of columns] -
                           [Measures].[Rightmost non root position])                          .Hierarchy.CurrentMember.Parent,
                          [Measures].[Ratio measure] )),
                    -- check division by zero
                    iif( ( Axis(1).Item(0)                           .Item([Measures].[Count of columns] -
                            [Measures].[Rightmost non root position])                           .Hierarchy.CurrentMember.Parent,
                           [Measures].[Ratio measure] ) = 0,
                           0,
                           [Measures].[Ratio measure]
                           /
                           ( Axis(1).Item(0)                             .Item([Measures].[Count of columns] -
                              [Measures].[Rightmost non root position])                             .Hierarchy.CurrentMember.Parent,
                             [Measures].[Ratio measure] ) )
                 )
            )
       ),
    FORMAT_STRING = "percent"
;


The first measure detects axis that has measures when using OWC.

The second measure is our ratio measure. That is, the measure we want to calculate the ratio for. I provided the syntax for several scenarios. The first one, of course, is the obvious and easiest one – using any measure we want and hard-coding it there. The second option is more general one – the use of cube’s default measure. Meaning, it could work for any cube. Finally, the third and the most complex option is to use the first measure on axis, whatever it might be. That’s even more general solution. In that scenario, it is up to an end-user to put a measure of his choice as the first measure and to see ratios based on that measure. It should work in any cube/report/query. The calculation features a handle for no measures at all (except that ratio measure) in which case the default measure is taken.

Next we test whether the original, ratio measure is empty. We’ll use the result of this in the following calculations, in order to preserve empty rows.

Count of columns gives us count of hierarchies being placed on an axis of interest (that is rows or columns, depending on where measures are not).

Next thing we do is generate a bitmap, and right next to it – a reversed bitmap. Innermost logical test returns either –1 or 0 (True or False), while minus in front of it turns -1 into 1. Looping is performed on a set of measures (which might be a week point – it is up to BI designer to provide something better in case there are only few measures). From which axis is bitmap formed? Depends on measures position in OWC. Additionally, in the reversed bitmap, the reversed order is obtained as it is usually being done in MDX – using a combination of two MDX functions: Count and CurrentOrdinal.

Why do we needed reversed bitmap? It becomes obvious once we come to the next calculated measure – Rightmost non root position. Analysis should be performed backwards, from right to left. That is the order in which we search patterns in bitmaps and therefore we needed reversed bitmap (string search is left based). This new measure returns us the position of the first zero value. In the table featuring 5 distinct cases, those positions are: 1, 2, 3, 2, 0.

Next measure is a Boolean type measure that detects a special case (see the table above) and that special case is 001 combination, where, per request, the value should be 100%.

Finally, we come to the last and the only visible measure – Universal Ratio %. There, the first thing we should do is test for emptiness of original ratio measure. Then only we handle the cases in our table. After covering cases with 100% result, based on where the measures are, we enter one branch and there test denominator for zero. Finally, we perform the ratio calculation. Only by now it is in utmost relative form, covering wide varieties of cases withonly one expression (notice the use of Rightmost non root position measure inside the innermost calculation). That’s the power and beauty of having and using bitmap indexes.

UniversalPercentageInOWC

BENEFITS

It’s worth reminding again that the final formula looks complicated only because of two reasons: OWC is being used as a front-end and, there were special cases in the bitmap table. Without them, the calculation would come down to always necessary checks for emptiness and division by zero, following by the core ratio expression. In case you’re using a client that keeps measures on the axis you’ve dropped them on in your pivot, you can consider stripping down all unnecessary calculations or part of it, as mentioned in the beginning of this article.

I also made tests with real bitmaps. Meaning, I tried to use numbers, 2 powered to N, where N was the number of hierarchies on axis. Yet that turned out to be not only a dead-end (because the reverse operation is not easy), but also time consuming, prolonging the query time significantly. String operations on the other hand were very fast and manipulations with them very easy. Relatively, of course.

All in all, bitmaps and their power in being flexible pointers proved to be an interesting approach in providing universal MDX solutions, calculations that, did I mention it before, work in any cube.

Oct 252009


“Life is like a box of chocolate: You never know what you’re gonna get.”

It is not the exact memorable quote from the Forrest Gump film, rather simply a form of it which I’ve memorized. Moreover, being excited about the package with three blue letters on it I’ve just received, it’s also the one I find the most appropriate for the series of articles I intend to write.

What’s the topic this time? Randomness in MDX.

Having thought about it for a while, I’ve recognized three variants of it: random values, random members and random objects. Each a story by itself. Therefore, I’ve decided to cover them separately, starting with chocolate flavors representing, well, you’ve guessed it by now – random values.

INTRODUCTION

Imagine a box full of chocolates. Each chocolate being filled with some delicious ingredient. How many different ingredients are there in total? What do they taste like? Which shape would you try first? You feel tempted. The hand moves. A mixture of tastes overwhelms your senses as you reach for them one by one, experiencing the a short glimpse of sensation as their sweetness melts in your mouth. You repeat the process and the next thing you know, they’re gone. All of them.

Now, if that made you take a walk around a place you’re at, be sure to come back soon and see how to simulate the same in MDX query.

RANDOM VALUES

There will be times when you’ll need unpredictable results. Possibly inside a range of values, yet random in nature. The solution is to create a calculated measure that uses VBA Rnd() function. Yet it’s not that easy as it looks like. Why? Because that function will provide repeating values in each row, that is, unless prepared properly. And here’s how.

WITH
-- initial settings
MEMBER [Measures].[Min Value] AS 10
MEMBER [Measures].[Max Value] AS 99
MEMBER [Measures].[Value Range] AS
       [Measures].[Max Value] - [Measures].[Min Value]

-- A) non-working approach, same number for all rows MEMBER [Measures].[Fixed Random Value] AS
Int( [Measures].[Min Value] +
            [Measures].[Value Range] * Rnd( ) ),
       NON_EMPTY_BEHAVIOR = '[Measures].[Sales Amount]'
-- B) working approach
MEMBER [Measures].[Random Value 1] AS
Int( [Measures].[Min Value] +
            [Measures].[Value Range] *
            Rnd( Rank( [Product].[Product Model Lines]                       .CurrentMember,
                       [Product].[Product Model Lines]                       .CurrentMember.Level.MEMBERS ) )
          ),
       NON_EMPTY_BEHAVIOR = '[Measures].[Sales Amount]'
-- C) working approach
MEMBER [Random number per row] AS
       Rnd( Rank( [Product].[Product Model Lines]                  .CurrentMember,
                  [Product].[Product Model Lines]                  .CurrentMember.Level.MEMBERS ) )
MEMBER [Measures].[Random Value 2] AS
Int( [Measures].[Min Value] +
            [Measures].[Value Range] * [Random number per row] ),
       NON_EMPTY_BEHAVIOR = '[Measures].[Sales Amount]'
SELECT
    {
        [Measures].[Sales Amount],
        [Measures].[Fixed Random Value],
        [Measures].[Random Value 1],
        [Measures].[Random Value 2]
    }
    ON 0,
    NON EMPTY
    {
        [Product].[Product Model Lines].[Model].MEMBERS
    }
    ON 1
FROM
    [Adventure Works]


The first calculated measure (Fixed Random Value) will not generate random values, while the second two measures will (Random Value 1 and 2). The reason is that SSAS engine tends to determine what expressions can be considered deterministic and recognizes Fixed Random Value measure’s definition as one of them. In order to prevent that, we need to insert non-deterministic component as part of the expression, either by inserting it directly (Random Value 1) or by referring to a helper measure that contains it (Random Value 2).

Non-determinism is usually obtained by referring to current member or similar. Generally, that (unnecessary non-determinism) is something one should avoid if possible, because it slows down the query in most cases (causing additional loops and preventing block mode). However, here it was a requirement in order to achieve dynamic results. The Rank() function we used here is probably not the only way to achieve this.

Random values

Screenshot – Random values

Min and Max values are used in order to show how to make offset – the range doesn’t have to start from zero, as in this example.

Non_Empty_Behavior is used to eliminate rows that have no sales (notice NON EMPTY on rows). Without it, we would have rows with null value in sales regardless of NON EMPTY, because the random values wouldn’t be null. Hence we had to take care of it. Alternatively, that can be done using iif() inside calculations, or when you need to provide more complex condition (i.e. expression instead of a measure).

CONCLUSION

It is possible to have random values inside a calculated measure. The definition of that measure should include VBA Rnd() function and should also be non-deterministic in nature. In short, that means we inject a part of calculation that generates different values per each member/row on axis. In the above example that was achieved using Rank() function, because rank is different for each member.

The other thing we should take care of is providing a null value when it is required. For example, if some other measure in query is null, so shall our calculation return, to prevent additional rows from appearing when NON EMPTY is used on axes.

NEXT STEPS

That brings us to the end of part one. In the next part, we’ll cover samples of hierarchy, something which Mosha already covered here, and which is included in ASSP project on CodePlex. Nevertheless, I’ll try to provide additional examples of usability.

Finally, here’s a link for the same topic, yet in T-SQL, I managed to discover while performing search for related articles.

Sep 232009
 

Recently, I was asked to write a calculation that calculates the ratio to parent on rows that doesn’t depend on cube structure and that also works in OWC. The first part I managed to dig somewhere from the past, the second proved to be much more demanding task. Having bypassed several obstacles and spent significant portion of time on this subject, I decided to pass the knowledge in form of a blog article. Here’s the calculation:

CREATE MEMBER CURRENTCUBE.
[Measures].[Universal share percent for OWC in BIDS %] AS

   iif( IsError( Extract( Axis(0), Measures ).Item(0) ),
   iif( IsError( Extract( Axis(1), Measures ).Item(0) ),
   iif( Axis(1).Item(0).Item(
 Axis(1).Item(0).Count - 1
)
.Hierarchy.CurrentMember.Level.Ordinal = 0,
1,
Extract( Axis(2), Measures ).Item(0)
/
(
Axis(1).Item(0).Item(
Axis(1).Item(0).Count - 1
).Hierarchy.CurrentMember.Parent,
Extract( Axis(2), Measures ).Item(0)
)
),
iif( Axis(0).Item(0).Item(
Axis(0).Item(0).Count - 1
)
.Hierarchy.CurrentMember.Level.Ordinal = 0,
1,
Extract( Axis(1), Measures ).Item(0)
/
(
Axis(0).Item(0).Item(
Axis(0).Item(0).Count - 1
).Hierarchy.CurrentMember.Parent,
Extract( Axis(1), Measures ).Item(0)
)
)
),
iif( IsError( Axis(1).Item(0) ),
1,
iif( Axis(1).Item(0).Item(
Axis(1).Item(0).Count - 1
)
.Hierarchy.CurrentMember.Level.Ordinal = 0,
1,
Extract( Axis(0), Measures ).Item(0) /
(
Axis(1).Item(0).Item(
Axis(1).Item(0).Count - 1
).Hierarchy.CurrentMember.Parent,
Extract( Axis(0), Measures ).Item(0)
)
)
)
),FORMAT_STRING = "Percent",
VISIBLE = 1;

What’s good about it is that it can be used in any project.

I also enhanced it a bit, to support other clients/controls as well (SSMS included).

Finally, it can be used as a template for other calculations that use Axis() function and are intended to work in Cube Browser.

ATTENTION: The improved variant of the same calculation can be found in a more recent blog article here.

Aug 142009
 
Chris Webb recently blogged about a strange phenomenon regarding sets in where clause and auto-exists. Today it occured to me that I had experienced a similar issue while doing some testing a year from now. A quick search on the right words (Tomislav Darren set slicer) and the exact thread popped up first in SSAS forum search engine.
 
After I’ve read it, I was very much intrigued by Chris’ post, so I’ve read it and tested it too, and then decided to spend few hours in order to find out what’s going on in the examples he provided, hoping to discover a general rule of this “weird” behavior and, most of all, the answer “why”.
 
Whether I succeeded or not, I’ll leave up to you. The explaination follows.


First, let’s make the summary of facts.
 
Here is the list of queries, how the MDX looks like, what do they return (not values, we focus on members), as well as short description of behavior/mechanism behind.


Query 1 – returns the value of 01-07-2001 (member in slicer wins in advance by forcing fixed and explicit coordinate on 20010701)
select [Measures].[Internet Sales Amount] on 0,
[Date].[Fiscal].[All Periods] on 1
from [Adventure Works]
where( [Date].[Calendar].[Date].&[20010701] )
 
Query 2 – returns the value of All Periods (axis wins because there’s a set in slicer)
select [Measures].[Internet Sales Amount] on 0,
[Date].[Fiscal].[All Periods] on 1
from [Adventure Works]
where( { [Date].[Calendar].[Date].&[20010701] } )
 
Query 3 – returns the value of 2001 (“nobody” wins, a tuple is formed from axis and slicer members, which in the end manifests as 2001 has won)
select [Measures].[Internet Sales Amount] on 0,
[Date].[Fiscal].[All Periods] on 1
from [Adventure Works]
where( { [Date].[Calendar Year].&[2001] } )
 
Query 4 – returns the value of 01-07-2001 (“nobody” wins, a tuple is formed from axis and slicer members, which in the end manifests as 20010701 has won)
select [Measures].[Internet Sales Amount] on 0,
[Date].[Fiscal Year].&[2002] on 1
from [Adventure Works]
where( { [Date].[Calendar].[Date].&[20010701] } )
 
Query 5 – returns the value of 01-07-2001 (again, axis wins because there’s a set in slicer)
select [Measures].[Internet Sales Amount] on 0,
[Date].[Calendar].[Date].&[20010701] on 1
from [Adventure Works]
where( { [Date].[Fiscal].[All Periods] } )
 
Query 6 – returns the value of All Periods (again, axis wins because there’s a set in slicer, similar to Query 2)
select [Measures].[Internet Sales Amount] on 0,
[Date].[Fiscal].[All Periods] on 1
from [Adventure Works]
where( { [Date].[Calendar].[Date].&[20010701], [Date].[Calendar].[Date].&[20010702] } )
 
 
OK, now something about colors, which will help us explain this faster and easier.
 
All queries except the first one have { } in the slicer. All hierarchies preserve their color throughout the queries. Fiscal hierarchies are warm-colored (orange, maroon), calendar hierarchies are cold-colored (green, blue). Each hierarchy has it’s own color, each member a nuance of that color.
 
Queries 1, 2 and 5 are similar. Let’s call them core queries. Query 6 is modified core query, it has another member in slicer. Queries 3 and 4 are special, they have one of the members present in core queries, and another one from a separate hierarchy. Attribute hierarchy, to be precise (one level only). On the other hand, core queries have user hierarchies (many levels).


Two things should be separated: autoexists and evaluation of cells.
 
The first of those two mechanism triggers in all queries because hierarchies in slicer and on axis belong to the same dimension. Therefore, only “existing” members on axis survive. In these examples it is not so obvious, but if you replace .[All members] with .MEMBERS (on axis only, not in slicer), you’ll see what I mean. Besides the root member, you’ll also get all members that a related. For example, this query:

select

[Measures].[Internet Sales Amount] on 0,
[Date].[Fiscal].
members on 1
from [Adventure Works]
where({[Date].[Calendar].[Date].&[20010701]})

gives you this result:
Date.Fiscal       Internet Sales Amount
All Periods              $29,358,677.22
· FY 2002                 $7,072,084.24
· · H1 FY 2002            $3,266,373.66
· · · Q1 FY 2002          $1,453,522.89
· · · · July 2001           $473,388.16
· · · · · July 1, 2001       $14,477.34
 
 
The issue in this weird case is not about autoexists. It performs perfectly. Therefore we will not focus on that. We will focus on something else – the evaluation of cells.
 
The second mechanism is the evaluation of cells. It means that for each cell of resulting table a tuple is being formed and then evaluated. Normally, a tuple consists of members. All hierarchies members. One from each. Some of them are explicitely there, some not (but are taken into account during tuple construction). If they are there, it also depends on where they come from (calculated member, slicer and axes are typical areas). In the same order they win over each other. Forcing the weaker to implicitely adjust to them. Members on axes adjust to slicer (autoexist), and slicer might get overwritten by a calculated member (if the formula says so). Except when we have sets in slicer. Then the situation is different.
 
From now on it’s all about my speculation.


They do participate in autoexist (as we stated before, no problem there), but I believe they do not force the coordinate the way a single member in a tuple in slicer does.
 
I believe set in tuple is made weaker than an explicit member from an axis on purpose. Because of that, if there comes a member in a tuple that is related to the hierarchy of that set, a set is implicitely replaced with a proper, related, single member in that hierarchy. If with nothing below, then with the root member.
 
And why is it made so?
 
Sets can have more than one member. In SSAS 2000, you would have to construct a calculated member and use that in slicer. Since there was no attribute relations in SSAS 2000, you could combine it freely. In SSAS 2005+ it’s different. Attribute relations exist. A potential calculated member (aggregate of set, maybe it is being done internally), just like all calculated members, is never related to any real member on any hierarchy. When selected, it forces the rest of hierarchies (from same dimension only, to be precise) to shift their current members to their root.
 
If you only have that hierarchy in context, then fine, all other shift to All, there’s no conflict.
 
But what if another hierarchy is forcing its member in a tuple as an explicit member (i.e. a member coming from an axis)? That means we would have a conflict and would have to choose how to solve it, who’s to win. In SSAS 2005 and 2008 attributes are related. Inside a tuple they must all be aligned. As I stated earlier, there are rules who wins. Calculated members, then slicer, then axes. In this case, I guess it has been decided that a member is stronger than a set. Somebody had to step back.
 
Why? Because there might have been problems otherwise. Members in a set may have different related members on other hierarchies. More than one per same hierarchy. If the set was stronger, then we would end up with more than one “currentmember” on other hierarchies, which a tuple doesn’t support. We would end up with a subcube. Therefore, sets must be weaker and adjust.


How about they intersect, find a common area in multidimensional space and then evaluate? Well, it’s not that easy.
 
Some combinations change before they have a chance to intersect (form a tuple) because hierarchies are related (Query 1, 2, 5, 6). Others do intersect. In Query 3 namely, there are two fiscal years that match 2001 calendar year. It can’t be so, therefore, that hierarchy is shifted to root member, not to interfere. Likewise, Query 4 is ok, members form a tuple, intersect and get evaluated.


And if they would intersect before the attribute relations mechanism? OK, but how? Who should adjust to whom when you have an intersection that is not a tuple but a subcube (set of tuples)?
 
Here’s an example. Construct a set in slicer that causes SSAS to puke. As I witnessed a year ago, but failed to understand why.
 
SELECT

{   [Measures].[Sales Amount] } on 0
FROM
 
    [Adventure Works]
WHERE
( { [Date].[Calendar].[Calendar Quarter].&[2003]&[4],
    [Date].[Calendar].[Calendar Quarter].&[2002]&[4] },
    [Date].[Calendar Year].&[2003] )


Attribute relations are being triggered in order to get the rest of the tuple. The error was about a fiscal hierarchy (not present in a query!). Of course, it couldn’t be evaluated differently. Hierarchies in slicer are equally good, none of them should be prefered to win. One of them is having a set that implies 2 implicite currentmembers on another hierarchy. The result? An error:
 

Executing the query …

The MDX function failed because the coordinate for the ‘Fiscal Year’ attribute contains a set.

Execution complete


Ups, I haven’t explained how come the queries evaluate the way they did.
 
Query 1 is understandable, a coordinate is set and is kept throughout iteration over axes. Because a member in slicer is also the intersection of itself with axis members, the result is its value.
 
Query 2 is evaluated as All Periods because there was a set in slicer (no matter it has one member only, it is still a set for SSAS). There were no calculated members, no members in slicer, so there was nobody to stop axis members to force the coordinate and make the others (set from slicer) to adjust to it this time. It’s not the whole story, but I don’t want to bring all the details yet. Follow on.
 
In Query 3 there was a member, year 2001, from another hierarchy. Attribute hierarchy. Again, it was a set in slicer. However, it won. How come? The same thing happened as in Query 2. But after the end of the tuple formation process (attribute relations mechanism in action), by some miracle 2001 survived. Or it wasn’t such a miracle?
 
If you take a look at user hierarchies in Adventure Works database, you’ll see that Date and Month are common attributes in both Calendar and Fiscal user hierarchy. That means that in the Query 2 the date in July was overwritten because it was used in the Fiscal hierarchy as well as in Calendar hierarchy. Currentmember of Fiscal hierarchy was All Period. That we had on axis. Having established one and only one current member per that hierarchy caused Date hierarchy (as well as Date.Calendar hierarchy and many others) to shift their current member to All member (or related if any).
 
Now, in Query 3 we have another situation. We have a member from a hiearchy that is not directly related to All Periods on Fiscal hierarchy. Therefore, there was no overwriting. Both currentmembers, All Periods from Fiscal hierarchy and 2001 from Year attribute hierarchy came in the tuple and the result was evaluated as result for 2001. As there was nothing on axis.
 
Query 4 is a similar case. Both members end up in tuple, tuple is evaluated as intersection of them, meaning – 1st of July.
 
Query 5 is the opposite of Query 2. Members have switched their places. Since both can be found in the same hierarchy (Fiscal hierarchy), member on axis wins. One more time, Date attribute is the lowest level in both Fiscal and Calendar hierarchies. By selecting a date, we select date in both hierarchies. Now, it only matters who comes in tuple first (axis member in case of set in slicer) as an explicite member, and who gets adjusted (set from slicer) because that hierarchy current member place is already taken.
 
Query 6? Same thing. No matter the number of members in set in slicer, axis member wins.


Is there a solution? Is it a bug afterall? Is there a workaround?
 
From what I analyzed and concluded, it was a decision. Which means – by design. However, a big part of this analysis is bases on assumptions.
 
Can it be improved?
 
I believe it can. Sets in where block can be tested if they contain a single member. MDX is full of shortcuts, different ways of writing this and that, one more wouldn’t hurt – single-member in a set in slicer is converted to a member. Afterall, the reverse path is present. A member placed on axis without {} around it, a member in lots of functions and so on, is converted to a set. Downconversion from a set to a single member would make Query 2 evaluate the same way Query 1 did.


But what if sets have multiple members in slicer? What coordinate should be set up?
 
Can’t tell. That’s the problem I guess.
 
Attribute relations mechanism is so strong and eager to chew everything first, that it breaks some tooths along the way, in situation like these. From time to time it might be better to consider letting autoexists be the first in line. In my last example, the one with an error, autoexisting the slicer (intersecting, so that what survives – survives) would leave only one quarter and the year, not causing the error. However, in more complex examples it wouldn’t help.


Apr 012009


“I made a trojan in MDX script!”

Although I deliberately timed this post to be published on my blog on 1st of April, this is far from a joke. And that trojan is a good one, for the benefit of all, as you’ll see soon.

While preparing my presentation about the potential use of Axis() function in calculated measures, I came up to a very interesting discovery: I wrote an MDX expression that allows the use of Axis() function inside dynamic sets in MDX script! Since the use of Axis() function is not supported in dynamic sets, I named the expression Trojan horse for dynamic sets, because of how it tricks the engine and makes Axis() function pass through.

Lets say a few about dynamic sets. Their name suggest they are evaluated dynamically. Furthermore, MSDN definition says they are evaluated everytime they are used in a query. But all that is simply not so. They are actually less powerful (about what I just googled one post from Chris Webb) because they get evaluated only once, before evaluation of cells (where all the fun is usually happening).

Dynamic sets are evaluated much sooner in query execution phases – after (which means in the context of) slicer and subselect. And that brings us to a final conclusion. As opposed to static sets that are static all the time, dynamic sets are just fine-tuned according to slicer and subselect of a query, but are pretty much static when it comes to evaluation of cells on the intersection of axis. In short, they behave just like query defined sets. And I consider them static. Get the idea of problematic name?

I don’t know where I’ve read it, so I made a short search on the net in order to present some proof for that. The best article on that subject that I come upon in a relatively short time is one older post from Mosha (of course). Since I haven’t read it yet and it looks very related to the thing I’m about to show you, I’ll read it now in order not to repeat things here.

Ok, I read it. That thing about subselect is nice.

Now let’s get back to what I ment to present you.

While being active on MSDN SSAS forum, I came up to this thread, where Bryan C. Smith nicely pointed out to me that my advice about the use of Axis() function simply doesn’t hold since it’s not allowed in MDX script. I played with it for a while, but encountered some problems, so I quit and concured with him.

But, being persistant (not to say stubborn) as I am, I took another chance as soon as I saw the first opportunity for that, a time when I was deeply into that issue – preparing a session about Axis() function. And I succeeded! Yes!

If you need a reason for it, I mean, reason why I wanted to do it, just take a look at that thread – making dynamic sets evaluate according to a measure placed on the opposite axis. Isn’t that great possibility? I mean, people ask for it, yet it isn’t supported. So, what do we do? Wait for the next release, for the new Extra Dynamic Sets? Yeah, right.

Why not think of something magical and use it now. This same moment. Why wait? All we need is some kind of expression that will evaluate differently when in MDX script as opposed to query context. But how? What differs those two environment?

When query executes, there are axis. When MDX script is evaluated, we have default measure in context. And iif function is optimized in various program languages not to evaluate on both paths, for performance reasons. Could it be my gate for trojan? Can I somehow make a trojan horse in MDX script that will pass the Axis() function hidden inside various iifs or other constructs and at the same time trigger properly when in context of a query?

Yes! It can be done. Here it is.

Create Dynamic Set CurrentCube.[Query measures evaluated] As
— aka Trojan for Dynamic Sets
        iif(Measures.CurrentMember Is Measures.DefaultMember,
            iif(IsError(Axis(1).Count),
   
            iif(IsError(Axis(0).Count),
                    {Measures.CurrentMember},
                    iif(IsError(Extract(Axis(0), Measures).Count),
                        {Measures.CurrentMember},
                        Extract(Axis(0), Measures)
                        )
   
               ),
                iif(IsError(Extract(Axis(1), Measures).Count),
                    {Measures.CurrentMember},
                    Extract(Axis(1), Measures)
                   )
               ),
            {Measures.CurrentMember}
           )
      , Display_Folder = ‘Universal dynamic sets’;

Although it referes to Axis() function, this dynamic set evaluates correctly inside MDX script, yet returns a set of measures that are relevant for the query being executed when triggered from that same query. What does that mean?

If the query doesn’t contain any measure, a default one is returned. If the query contains a measure on slicer, that measure is returned. If a query contains measure in subselect, (only) first measure inside is returned (a default for that subcube). Here’s a possibility for improvement, for eager ones. If a query contains measures on columns, they are returned. If the query contains measures on rows, they are returned. All in all, it collects measures from query, wherever they are.

How is it achieved?

First, let’s get one thing straight. Everything you write in MDX script of a cube needs to be evaluated and checked for errors before it is deployed. Meaning, if you naively reference Axis() inside it, withouth cloaking it properly, you’ll see an error that it is not allowed to use the Axis() function and you won’t be able to deploy. So we need to cloak it somehow. And here’s how.

When that expression is evaluated/checked in MDX script, the first condition (always) evaluates as False. That’s the main trick. Why? The CurrentMember doesn’t exist yet, it exists only in query! Which means that the whole expression results as an empty set ({Measures.CurrentMember} in False part evaluates to null set). SSAS engine doesn’t check the construct in True part (performance optimization, luckily for us) and treats it as a deterministic expression – an empty set. In other words, this {}.

Everything’s clean and fine. We’re in (whisper men in the horse)!

Now, we could have put anything that will evaluate to False in the first condition but we didn’t. We carefully constructed that condition, because we need it to evaluate differently once it is called from a query. CurrentMember is a valid expression in the context of query. On the other hand, current member might or might not be default member. And that means we got ourselves a perfect condition, the one that evaluates either as True or False when triggered from query (which is ok, our condition is therefore not static, but a dynamic, smart one) and the one that is always False (static, which is ok) when evaluated/checked inside MDX script for deployment.

If the set is evaluated in a query, then depending on where the measures are placed in that query, a different path will be chosen. The first condition will be True in most cases. Only in situations when there is some other measure, not a default one, placed in slicer or subselect it will also evaluate to False. How come? Remember that dynamic set is evaluated in context of slicer and subselect, so that first expression catches scenarios when we have something there. In case it is False, we will grab the current member. That means a measure in slicer or the first measure in subselect (since when you make a subselect, the first measure inside becomes a default one automatically for that subcube). And that is exactly what we need.

In other words, the first condition will evaluate as False and take that path only for MDX script evaluation AND for measure in slicer/subselect other than a default one. Two flies, one stroke!

In all other cases the first condition will evaluate as True which means we don’t have measures in slicer or subselect. If that is so, they might be on axis. We test Axis(1) first, then Axis(0). If by some chance there are no measures on either of axes (a query without measures was executed), default measure is implicitely in slicer and that is taken as currentmember.

If measures are on axis, they will be extracted carefully.

That’s basically the operating mode of this trojan.

The explaination above was corrected and enriched 8 hours after the initial post, after a revision and after my memory about all the tips and tricks concerning this issue was refreshed. The key parts that were changed are evaluation paths.

Now, typical dynamic set looks like this.

Create Dynamic Set CurrentCube.[Top 10 Products for slicer measure] As
        TopCount(
                 [Product].[Product].[Product].Members,
                 10,
                 Measures.CurrentMember
                )
      , Display_Folder = ‘My demo sets’;
 

It operates only on slicer and subselect, as we stated before.

However, this new dynamic set, an improved version of previous example, uses the first measure in trojan no matter where it is (as long as it is not on the same axis – it can be on opposite axis or slicer/subselect).

 Create Dynamic Set CurrentCube.[Top 10 Products for first measure] As
        TopCount(
                 [Product].[Product].[Product].Members,
                 10,
                 [Query measures evaluated].Item(0).Item(0)
                )
      , Display_Folder = ‘My demo sets’;
 

And finally, in order to test all this, you would need to add those definitions into your Adventure Works 2008 database (in the end of MDX script), and fire the following queries (or your variants of it).

SELECT
NON EMPTY
    {
       
[Measures].CurrentMember
    }
ON AXIS(0),
    NON EMPTY
    {
        [Top 10 Products for first measure]
    }
ON AXIS(1)
FROM
    [Adventure Works]

SELECT
NON EMPTY
    {
        [Measures].[Order Quantity],
        [Measures].[Reseller Sales Amount]
    }
ON AXIS(0),
    NON EMPTY
    {
        [Top 10 Products for first measure]
    }
ON AXIS(1)
FROM 
    [Adventure Works]

SELECT
NON EMPTY
    {
        [Measures].[Reseller Sales Amount],
        [Measures].[Order Quantity]
    }
ON AXIS(0),
    NON EMPTY
    {
        [Top 10 Products for first measure]
    }
ON AXIS(1)
FROM 
    [Adventure Works]

SELECT
NON EMPTY
    {
        [Measures].CurrentMember
    }
ON AXIS(0),
    NON EMPTY
    {
        [Top 10 Products for first measure]
    }
ON AXIS(1)
FROM
 
  (SELECT [Measures].[Order Quantity] ON 0 FROM [Adventure Works])

SELECT
NON EMPTY
    {
        [Date].[Calendar].[All Periods]
    }
ON AXIS(0),
    NON EMPTY
    {
        [Top 10 Products for first measure]
    }
ON AXIS(1)
FROM
    [Adventure Works]
WHERE
   
([Measures].[Order Quantity])

In case you have any doubts about results, feel free to make another query, the one where you’ll precisely write what do you want, so that you can verify whether Top 10 Products dynamic set calculates correctly or not.

Once you cast your fears aside, feel free to use it in any of your projects in case you need it.

Oh, one more thing. Excel 2007 and OWC are immune to it, they can not profit from this discovery. Only those OLAP clients/tools that generate clean MDX (no fancy stuff in subselect) and respect sets in general as a valid and powerful entity in OLAP (or let you at least edit the MDX if nothing else) are candidates for exploiting this trick. MDX Studio and CubePlayer are some of them known (and available) to me. Any information about other front-ends/tools?

More advanced MDX stuff coming soon :-).

Jan 192009


While doing some calculations for a client, I encountered a not so strange wish – to show an incremental number for each row of data. Although it seems pretty easy, I ended playing with it for several hours, because it had to be generic solution, the one that doesn’t depend on hierarchies placed on rows.

Finally I got it! Here it is.


WITH

MEMBER [Measures].[Count of Rows] AS
    Axis(1).Count

MEMBER [Measures].[Count of Hierarchies on Rows] AS
    Axis(1).Item(0).Count

MEMBER [Measures].[Row Number] AS
    Rank(
         StrToTuple(
                    "( " +
                     Generate( Head(Axis(1),
                                    [Measures].[Count of Hierarchies on Rows] ) AS L,
                              "Axis(1).Item(0).Item(" +
                               CStr(L.CurrentOrdinal – 1) +
                              ").Hierarchy.CurrentMember",
                              " , " ) +
                    " )"
                   ),
         Axis(1)
        )
    , FORMAT_STRING = "#,#"

SELECT
    {
        –[Measures].[Count of Rows],
        –[Measures].[Count of Hierarchies on Rows],
        [Measures].[Row Number]
    } ON 0,
    {
        [Date].[Calendar].[Calendar Year].MEMBERS *
        [Product].[Product Categories].[Category].MEMBERS
    } ON 1
FROM
    [Adventure Works]


It needs a bit more tweaking to become bulletproof, but I’ll leave that for some other occasion.

A remark for Excel users. Beware that Excel sometimes tricks you and keeps hierarchies on columns although they look like they are on rows. If you’re using Excel as an OLAP client, make sure you put 2 measures on columns, that will force hierarchies placed on rows to actually appear there.

Nov 032008
 

Few months ago, while on vacation, I saw an interesting post on MSDN forum where a user asked for rank of members placed on rows, irrespective of hierarchy. Furthermore, that was supposed to be achieved using only one calculated measure, nothing else. Intrigued by this puzzle, I made an example of such calculated measure on Adventure Works database using Axis() function. Here it is:

WITH
MEMBER [Measures].[Sales Amount Rank] AS
     iif(
         IsEmpty([Measures].[Sales Amount]),
        
null,
         Rank(
              Axis(1).Item(0).Item(Axis(1).Item(0).Count – 1
                                  ).Hierarchy.CurrentMember,
              Order(
                    Extract(
                            Axis(1),
                            Axis(1).Item(0).Item(
                                            Axis(1).Item(0).Count – 1
                                               
).Hierarchy
                           ),
                   [Measures].[Sales Amount],
                    BDESC

                   )
             )
        )
SELECT
{
    [Measures].[Sales Amount],
    [Measures].[Sales Amount Rank]
}

ON AXIS(0),
NON EMPTY
    [Product].[Category].[Category].MEMBERS *
    [Sales Territory].[Sales Territory Country].
                     
[Sales Territory Country].MEMBERS
ON AXIS(1)
FROM
    [Adventure Works]
 

Here’s how it works.

We should test for empty values first. Empty values of the measure on which we do ranking (Sales Amount in this example). This is done in order not to influence the original result, the one without the rank measure. Why? Because Rank() function returns numbers, never nulls. Normally, NON EMPTY serves to filter rows for which Sales Amount in the above example is null.  If we introduce the second measure that is never null, those rows will suddenly appear too. And this is not a wanted behavior.

Rank is made by using current member of the last hierarchy on rows, as requested. Ordered set is made by extracting that hierarchy and ordering its members by measure Sales Amount. The trick is that Order() function returns a different set of members for each row. In other words, current context (tuple) influences ordering of members. On each Category (first hierarchy), another ordered set of Countries (last hierarchy) might appear, because countries will be ordered per current product category. The same would work for any number of hierarchies on rows.

Recently, I was asked to make it even more universal (general) in a way to avoid ranking of members from different hierarchy levels at the same time. Meaning, if we place .ALLMEMBER, we don’t want [All] member to be ranked as 1, while all the others as second, third, and so on.

Another puzzle, another solution. This time I named it Goldfish Rank since it fulfills any wishes you might have about ranking in general. Here it is:

WITH
MEMBER [Measures].[Goldfish Rank] AS
    iif(
        IsEmpty(Axis(0).Item(0).Item(0))
        — making it absolutely general
        — using first measure on columns


        /*
        — un-comment this block if you want to get rank
        — only for lowest level members in you last column
        OR
        Axis(1).Item(0).Item(Axis(1).Item(0).Count – 1
                            ).Hierarchy.CurrentMember.Level.Ordinal <
        Max(
            Extract(
                    Axis(1),
                    Axis(1).Item(0).Item( Axis(1).Item(0).Count – 1
                                        ).Hierarchy
                   ),
            Axis(1).Item(0).Item(Axis(1).Item(0).Count – 1
                                ).Hierarchy.CurrentMember.Level.Ordinal
           )
        */

        ,
        null,

        Rank(
            
Axis(1).Item(0).Item(Axis(1).Item(0).Count – 1
                                 ).Hierarchy.CurrentMember,
             Intersect(
                       Order(
                             Extract(
                                     Axis(1),
                                     Axis(1).Item(0).Item(
                                             Axis(1).Item(0).Count – 1
                                                         ).Hierarchy
                                    ),
                             Axis(0).Item(0).Item(0),
                             — making it absolutely general
                             DESC
                             — BDESC would be redundant,
                             —
since we work per level
                            ),

                       iif(
                           Axis(1).Item(0).Item(
                                                Axis(1).Item(0).Count – 1
                                               ).Hierarchy.CurrentMember
                                               
.Level.Ordinal = 0,
                           Axis(1).Item(0).Item(
                                                Axis(1).Item(0).Count – 1
                                               ).Hierarchy.CurrentMember,

                          
NonEmpty(
                                    Axis(1).Item(0).Item(
                                            Axis(1).Item(0).Count – 1
                                                        ).Hierarchy.CurrentMember
                                                        
.SIBLINGS,
                                  { Axis(0).Item(0).Item(0) }
                                    — making it absolutely fast
                                   )
                          )
                       */

                       — /*
                       — this is the second block, referred above
                       — comment NonEmpty() function
                       — if you un-comment the block above

                       NonEmpty(
                                Axis(1).Item(0).Item(
                                                Axis(1).Item(0).Count – 1
                                                    ).Hierarchy.CurrentMember
                                                    
.Level.MEMBERS,
                              { Axis(0).Item(0).Item(0) }
                                — making it absolutely fast
                               )
                       — end of second block
                       — */

                      )
            )
       )
SELECT
{
    [Measures].[Sales Amount],
    [Measures].[Goldfish Rank]
}

ON AXIS(0),
NON EMPTY
{
    [Product].[Category].ALLMEMBERS
    * [Sales Territory].[Sales Territory].ALLMEMBERS
}

    — un-comment lower part and comment the line above
    — if you find it difficult to compare results
    — when the last column is hierarchized
    — and when applying rank on level members, not siblings
/*
*

{
    [Sales Territory].[All],
    [Sales Territory].[Group].MEMBERS,
    [Sales Territory].[Country].MEMBERS,
    [Sales Territory].[Region].MEMBERS
}
*/

ON AXIS(1)
FROM
    [Adventure Works]
 

This query has [All] members on rows. From both hierarchies. That serves for testing purposes of newly created calculated measure for rank.

Calculated measure used in previous example was enhanced in a way that it sorts only members that have the same level (or parent) as current one (current member from the last hierarchy). This is achieved using Intersect() function. Members on each level (or siblings, depends on the switch you make with blocks of code) will be ranked only according to equal to themselves. By the term equal, I assume those from the same level (or of the same parent). Metaphorically, having the same chance to be ranked as 1.

Second argument of Intersect() function should have been simple .MEMBERS from particular level (or .SIBLINGS), but that was optimized using NonEmpty() function and the same measure we rank by. Optimization means we reduce potentially large set of members by applying NonEmpty() function on them, so that only those having result for that measure will survive.

Goldfish Rank has several options how to deal with higher levels.

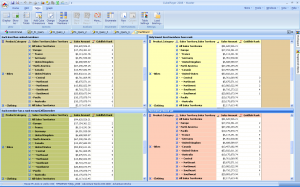
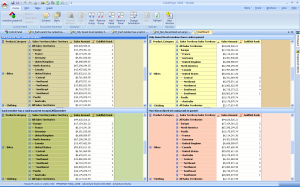
Goldfish Rank in level members      Goldfish Rank in siblings

First commented block enables user to rank only on lowest level members, while providing nulls for the rest. The second block enables user to avoid ranking the [All] member, since it will most probably always have rank 1. And finally, if you find it hard to match members from different levels in the example above, I provided commented block of several levels for the second user hierarchy on axis 1. This way results will not be hierarchized, so it will be easier for you to compare them and see them in action.

Another way of ranking is to rank among siblings. For that purpose, I provided a commented block inside Intersect() function. Using that instead of the block below (un-commented) will give us results as in right picture.

While there can be other variations of ranking, I assume the code above will suffice as a template for each of those variations. If you encounter any problems during that, remember to ask the Goldfish!

In the end, it’s worth saying that the forum user’s wish was fulfilled.

– If you like this post, be sure to drop by occasionally, since there will be more interesting MDX queries in the days to come.